Google Releases Mobility Report To Help Governments Track Social Distancing
2 min readSocial distancing is one of the key strategies implemented by governments around the world to arrest the spread of the 2019 novel coronavirus. To help officials monitor how communities have responded to this measure, Google has released COVID-19 Community Mobility Reports, available for download online.
Using “aggregated, anonymized data” from Google Maps, Google’s mobility report shows how movement of people in different types of places have changed since the enhanced community quarantine (ECQ) was implemented. These include groceries and pharmacies, parks, transit stations, parks, workplaces, and residential areas.
According to Google, the reports were developed with strict adherence to their privacy protocols, and protecting people’s privacy. “No personally identifiable information, such as an individual’s location, contacts or movement, will be made available at any point,” Google wrote on their Blog.
On Tuesday, April 7, Google published an early release representing data for the Philippines as of March 29, 2020. The company will show trends over several weeks in 131 countries, with data from 48- to 72-hours prior, going forward. The reports indicate a percentage point increase or decrease in visits to the different categories.
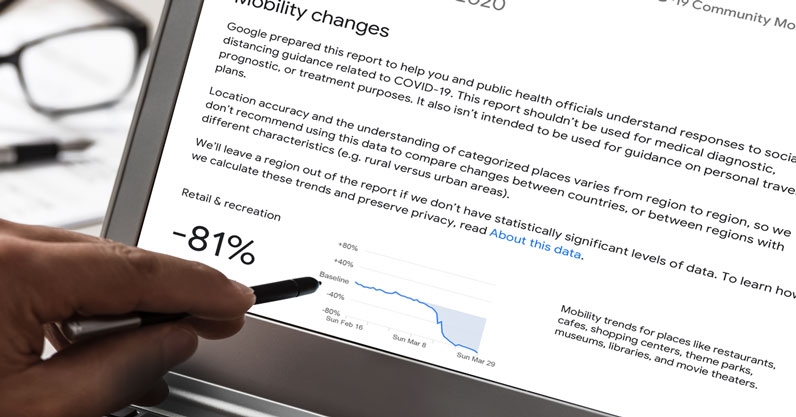
“Google prepared this report to help you and public health officials understand responses to social distancing guidance related to COVID-19,” the company notes. “This report shouldn’t be used for medical diagnostic, prognostic, or treatment purposes. It also isn’t intended to be used for guidance on personal travel plans.”
Shown below are excerpts as well as graphs lifted from the COVID-19 Community Mobility Report for the Philippines.
Mobility changes from February 16, 2020 to March 29, 2020
Retail and recreation
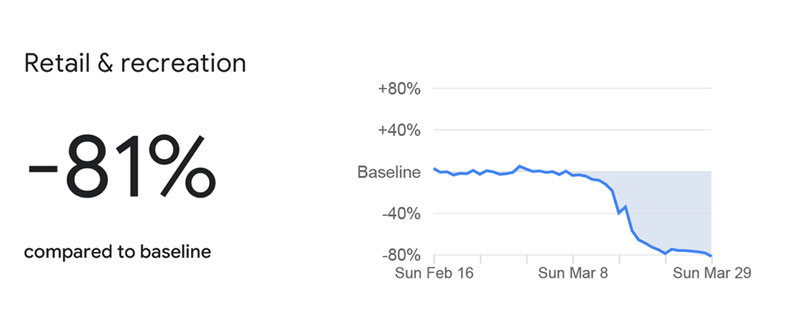
This includes movement in places such as restaurants, cafes, malls, theme parks, museums, libraries, and movie theaters—showing an 81% decline. With restaurants and shops closed for dine-in during the ECQ, we expect to see this slide down further in the coming days.
(Read: These Restaurants In Manila Are Open For Delivery During The Quarantine)
Grocery and pharmacy
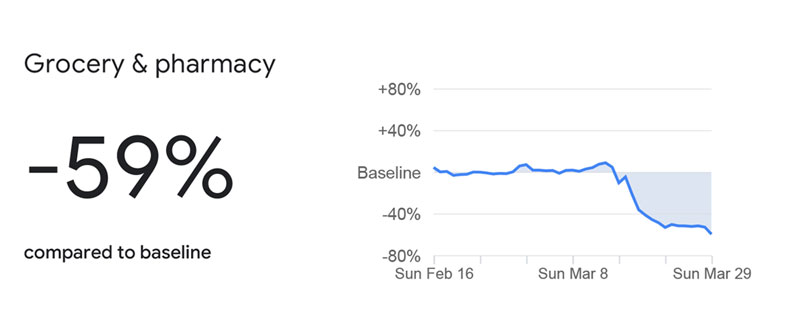
While local governments have issued quarantine passes for select household members and strongly advise against unnecessary trips to the stores, the drop in grocery, drugstore, and wet market visits is not as , with only -59% change from the baseline.
Parks
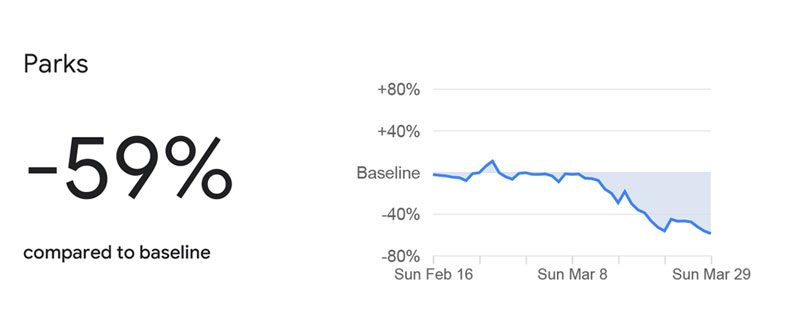
Meanwhile, mobility trends for places like national parks, public beaches, and plazas reflect a -59% change.
Transit stations
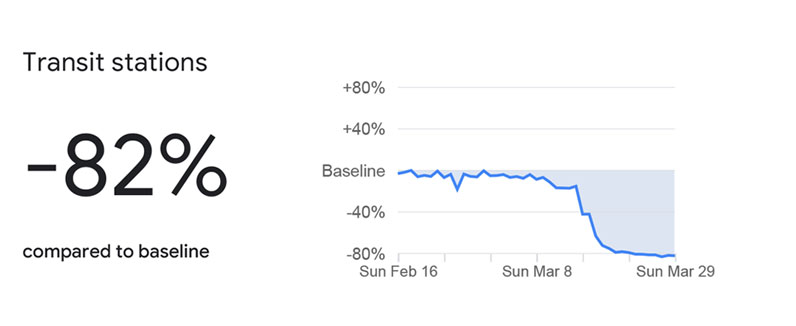
With all types of public transport on hold, it is not unusual to see an -82% drop in movement in transit stations, which here include terminals and train stations.
Workplaces
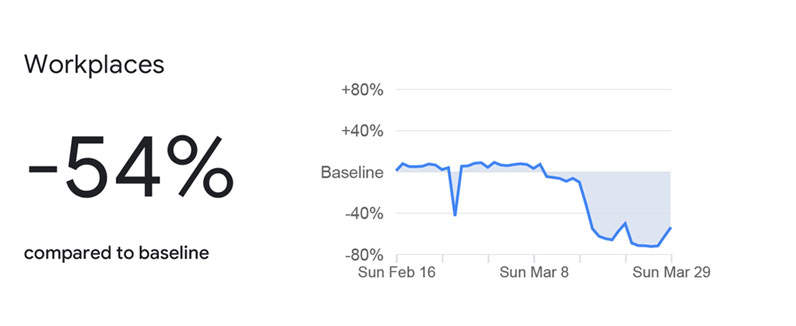
Mobility in office buildings and other workplaces has been cut by half, thanks to work-from-home policies and skeleton staffing measures enforced by companies particularly in Metro Manila, Luzon, and Cebu.
Residential
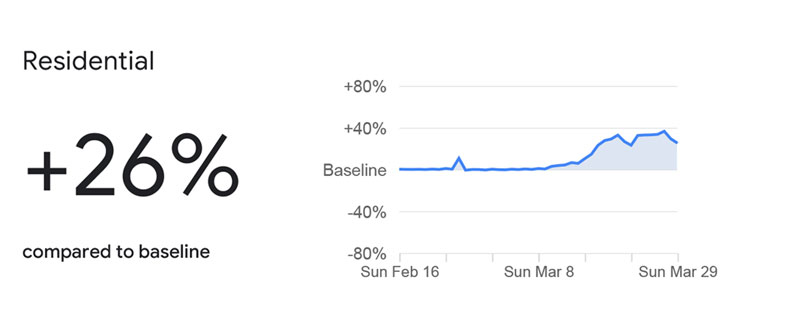
As quite expected, the report reflects a 26% increase in logs in residential areas. But in the wake of the extension of the ECQ until April 30, 2020, there is a strong need to see this number further up as more people are urged to stay at home.
Can I opt out of the data tracking?
The short answer? Yes. These reports are created only with data from users who have turned on the Location History setting on their mobile devices, which, by the way, is turned off by default. You may choose to turn this feature off anytime on your Google Account and delete your location history anytime.
About the author
eCompareMo eCompareMo is the No. 1 financial e-commerce site in the Philippines. Follow us on Twitter and Instagram: @ecomparemo.